When I moved into a new apartment one of the first things I noticed was how unstable my internet connection was; most of the time my connection would be fine, but frequently my service would drop completely, or response times would climb above 800ms. Any gamer knows anything above 100ms is pretty unbearable, at 800ms you are seemingly unable to do most things online, including basic web browsing.
In the process of debugging these instabilities I ended up building myself Ping-Graph.com, a simple visualizer of network latency. The service is based on a simple WebSocket server which sends a pong for every ping; most of the logic of the application is preformed in the client web-browser.
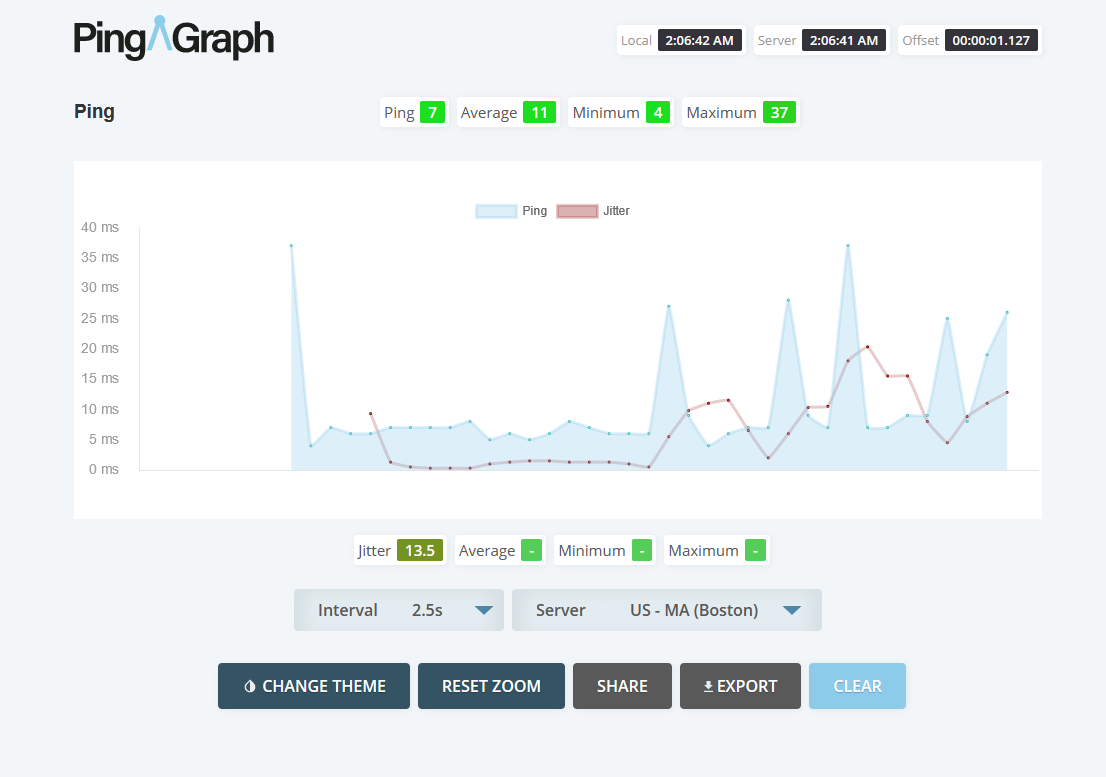
By simply starting a counter when we send a {ping} and evaluating the time elapsed when the {pong} is received, we can evaluate the round trip time between the client and server.